HOW TO VIEW SERVICE DEMAND CURVE
Last Updated: 2017-10-03 12:12:17.0
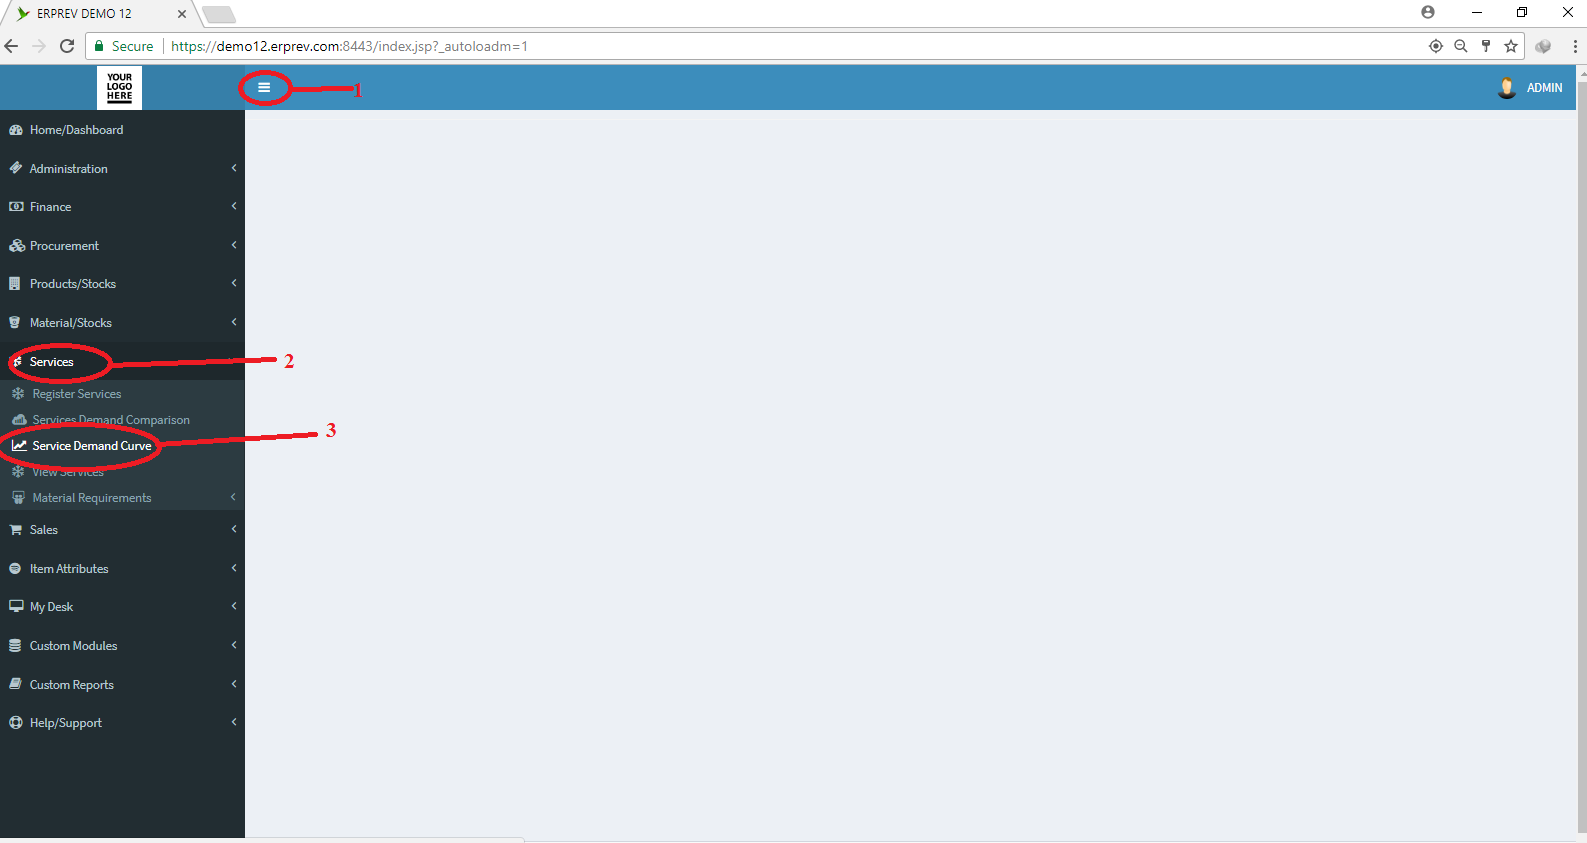
Mouse Hover on the Left Side.
Then Click on SERVICES, a list of features will appear and then you CLICK on Service Demand Curve.
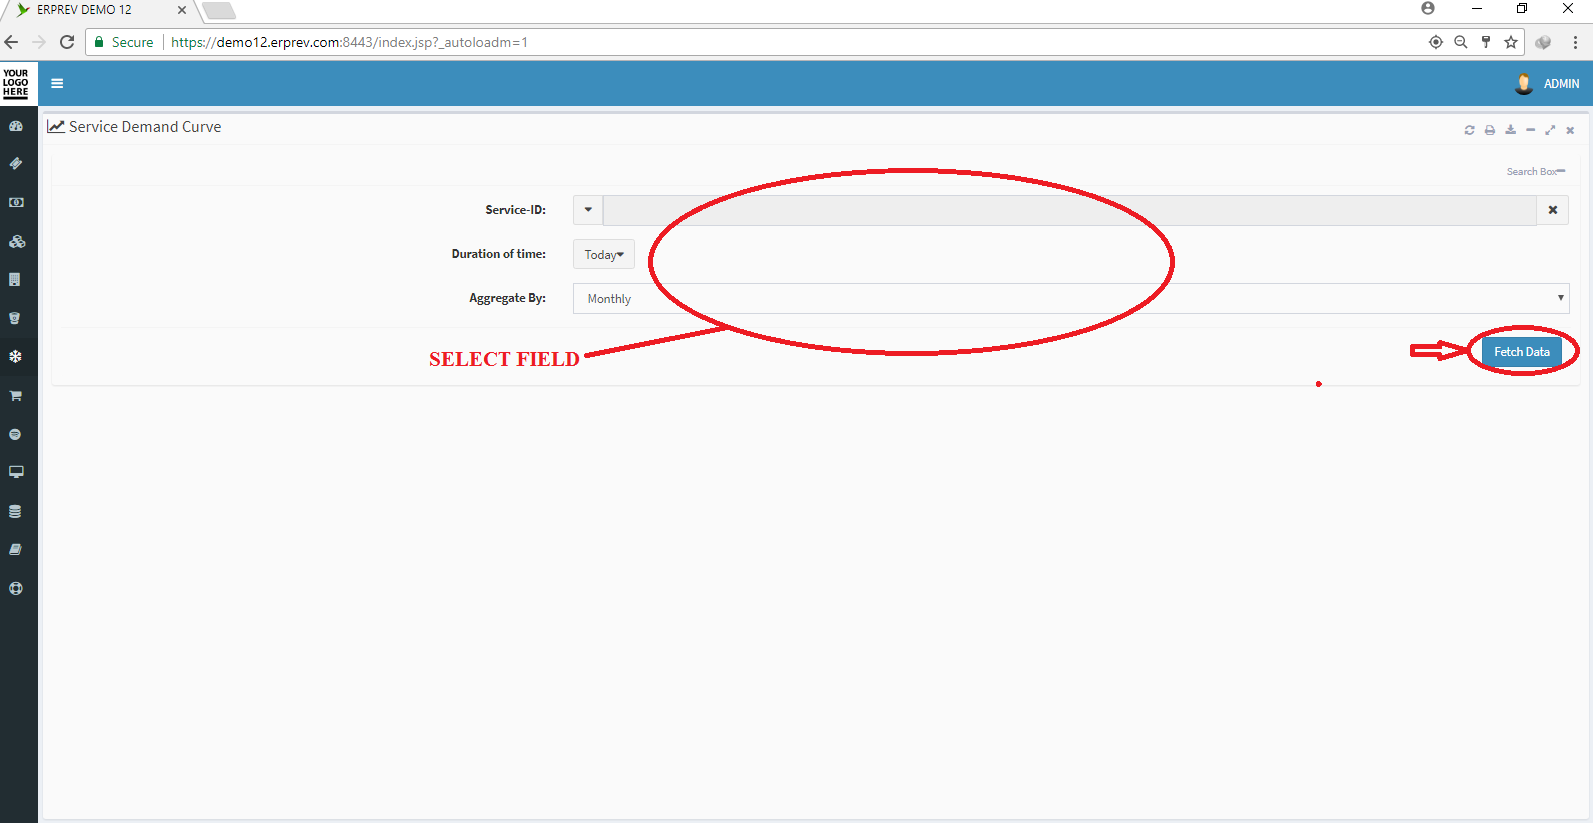
Select the Service, set the duration of time and aggregation type and then CLICK on Fetch Data.
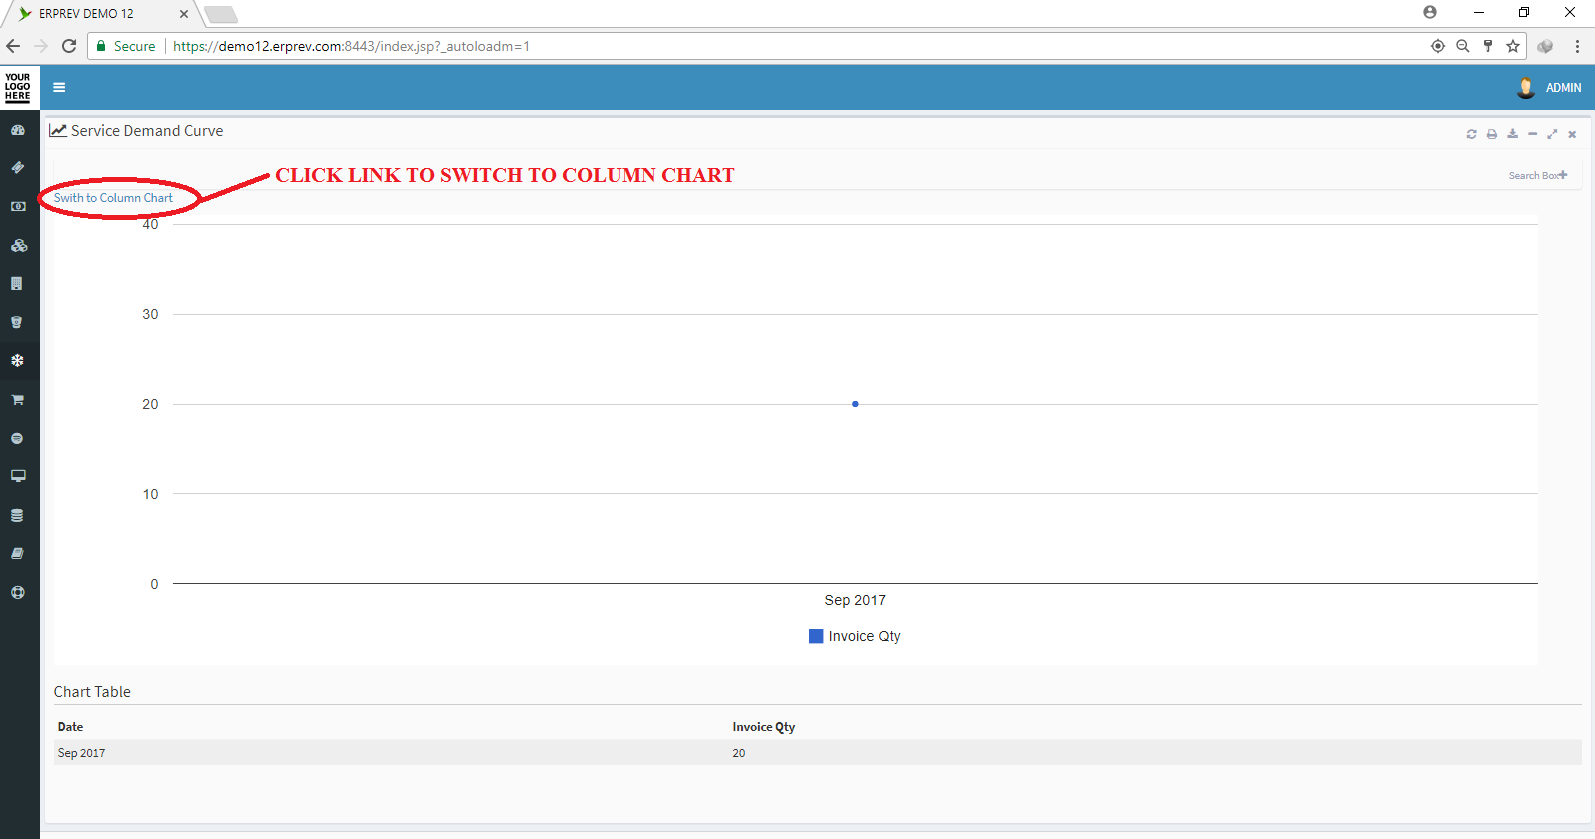
Below is the line chart but you can CLICK on Swith to Column Chart to see the information depicted in a different way.
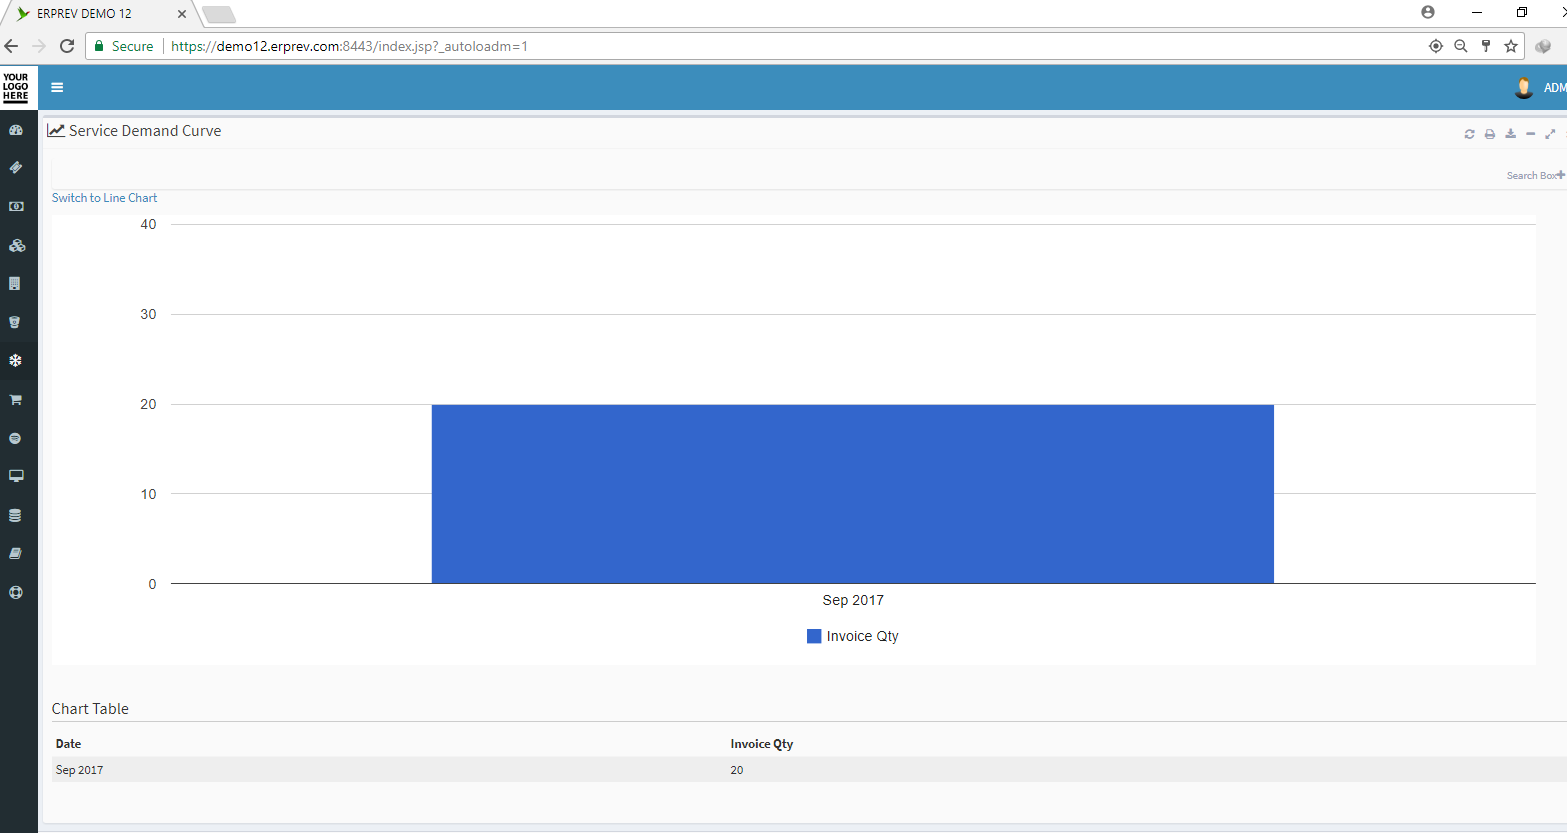
Below is the column chart.