HOW TO VIEW INVOICE ANALYZER/CHARTS
Last Updated: 2017-09-28 11:54:27.0
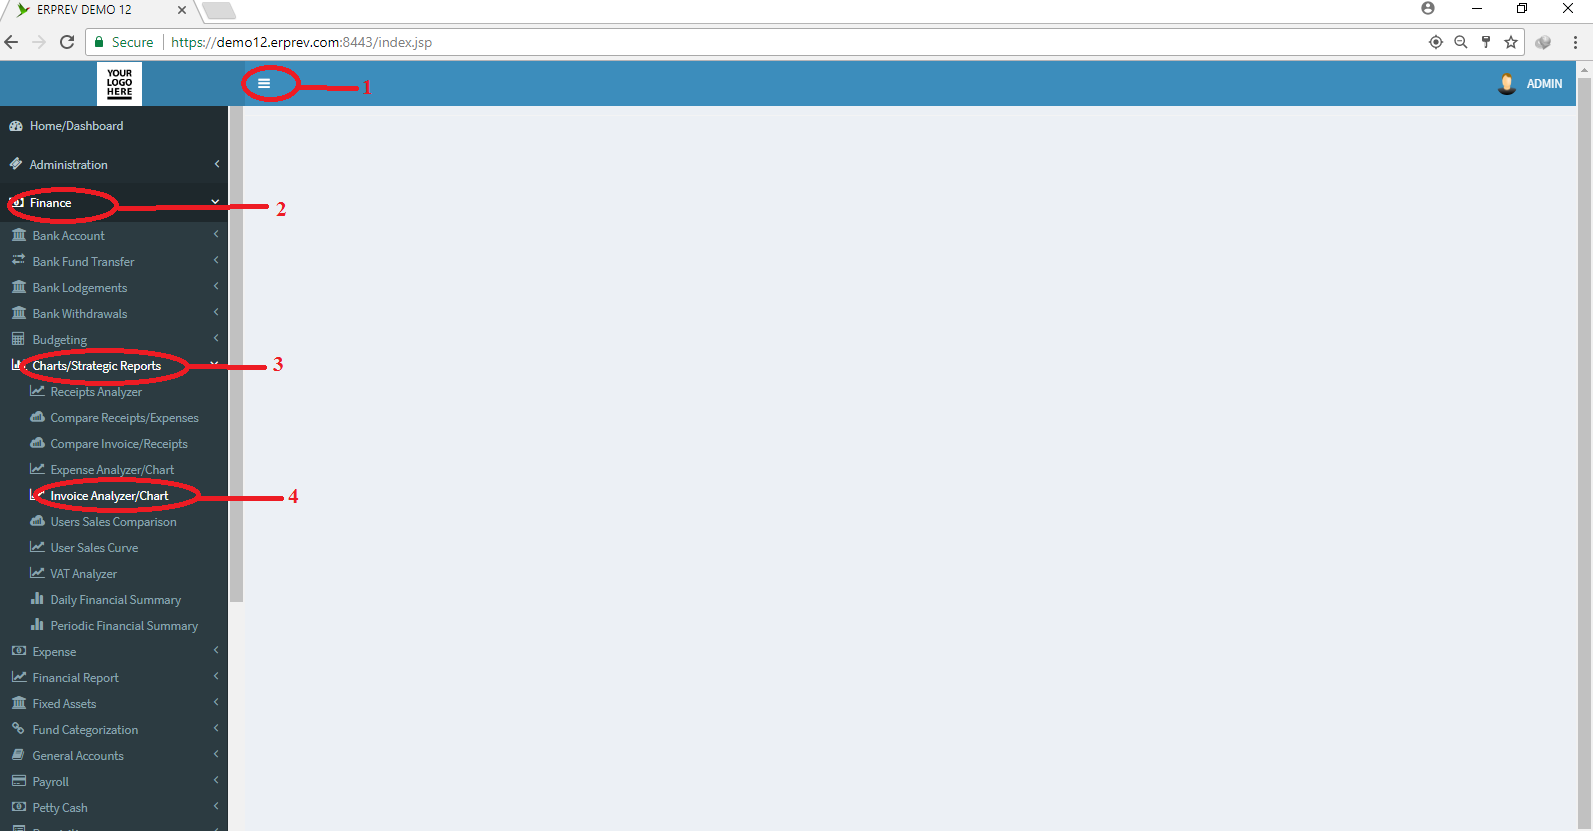
Mouse Hover on LEFT.
Then Click on FINANCE, a list of features will appear and then you CLICK on Charts/Strategic Reports.
A dropdown list appears and you CLICK on Invoice Analyzer/Charts.
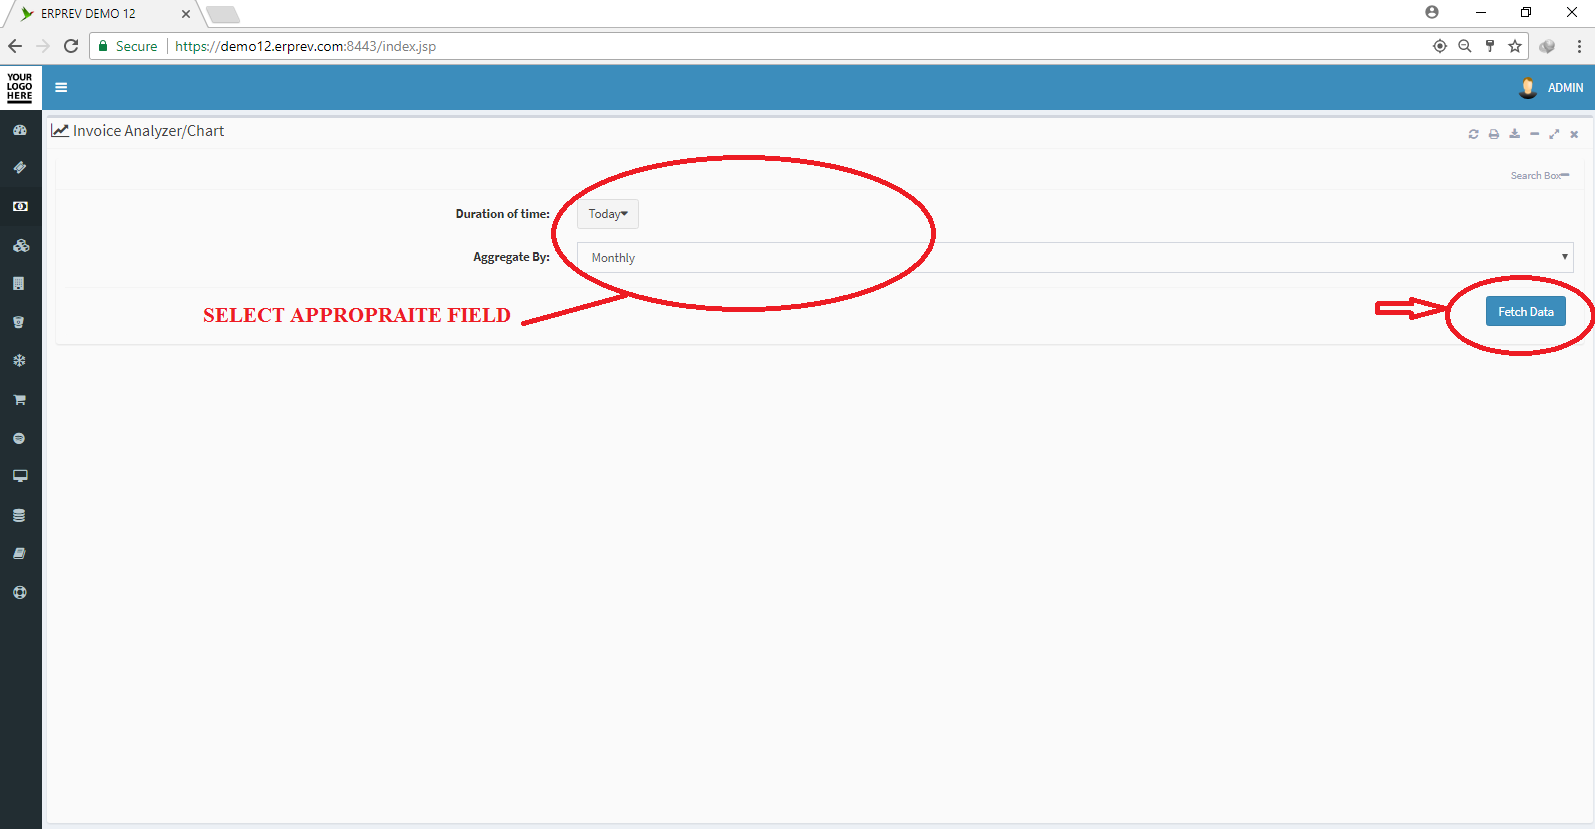
Select the duration of time and aggregate the record either daily, weekly, monthly, quartely, bi-anually, anually or period specified above and CLICK on Fetch Data
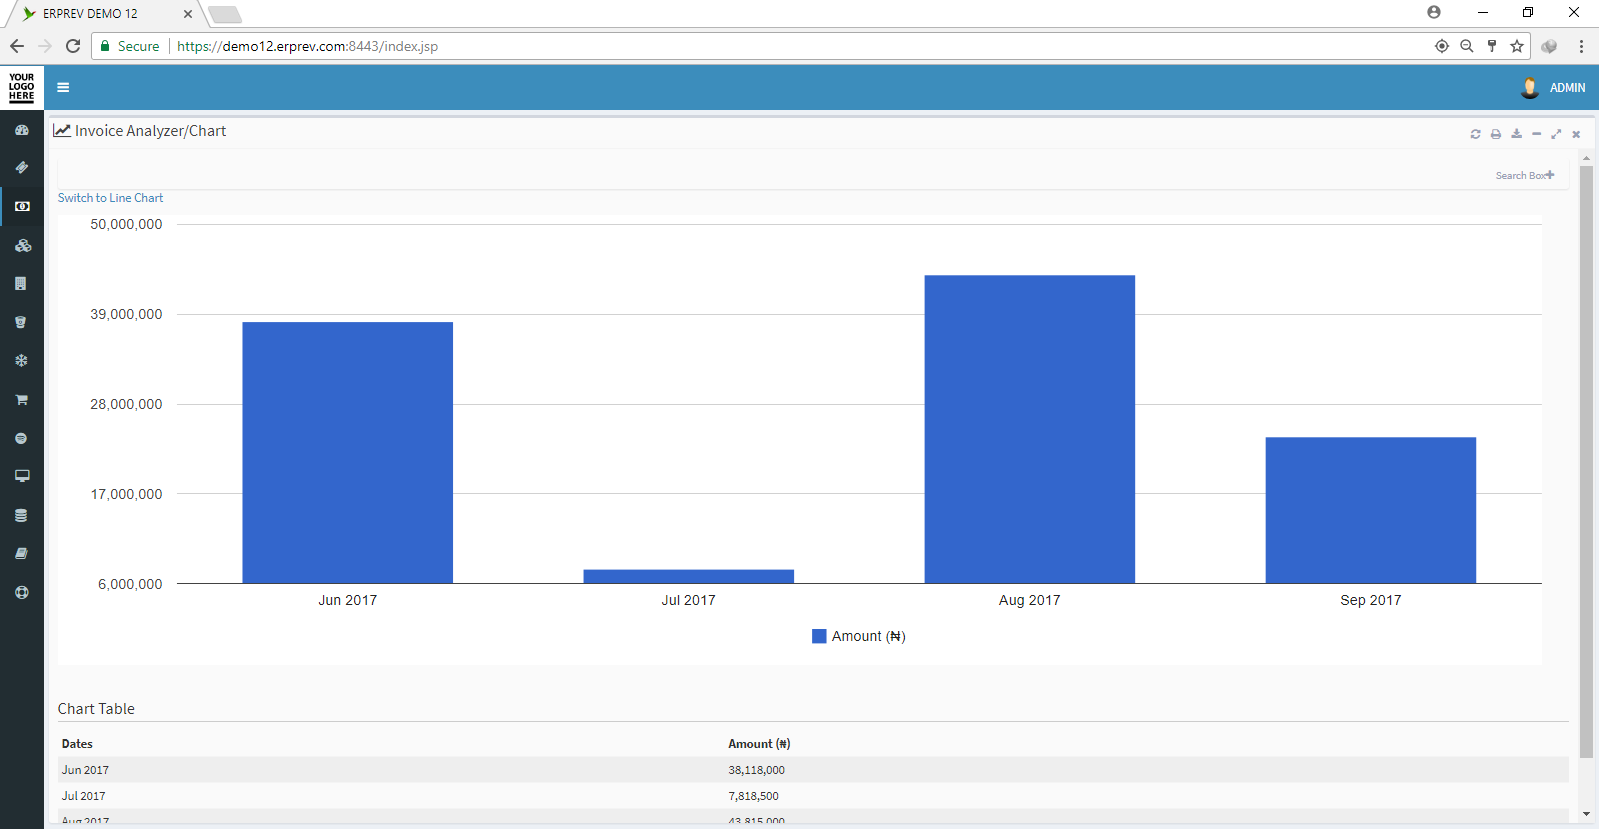
You can switch from Line Chart to Column Chart by CLICKING on the icon indicated in the image below
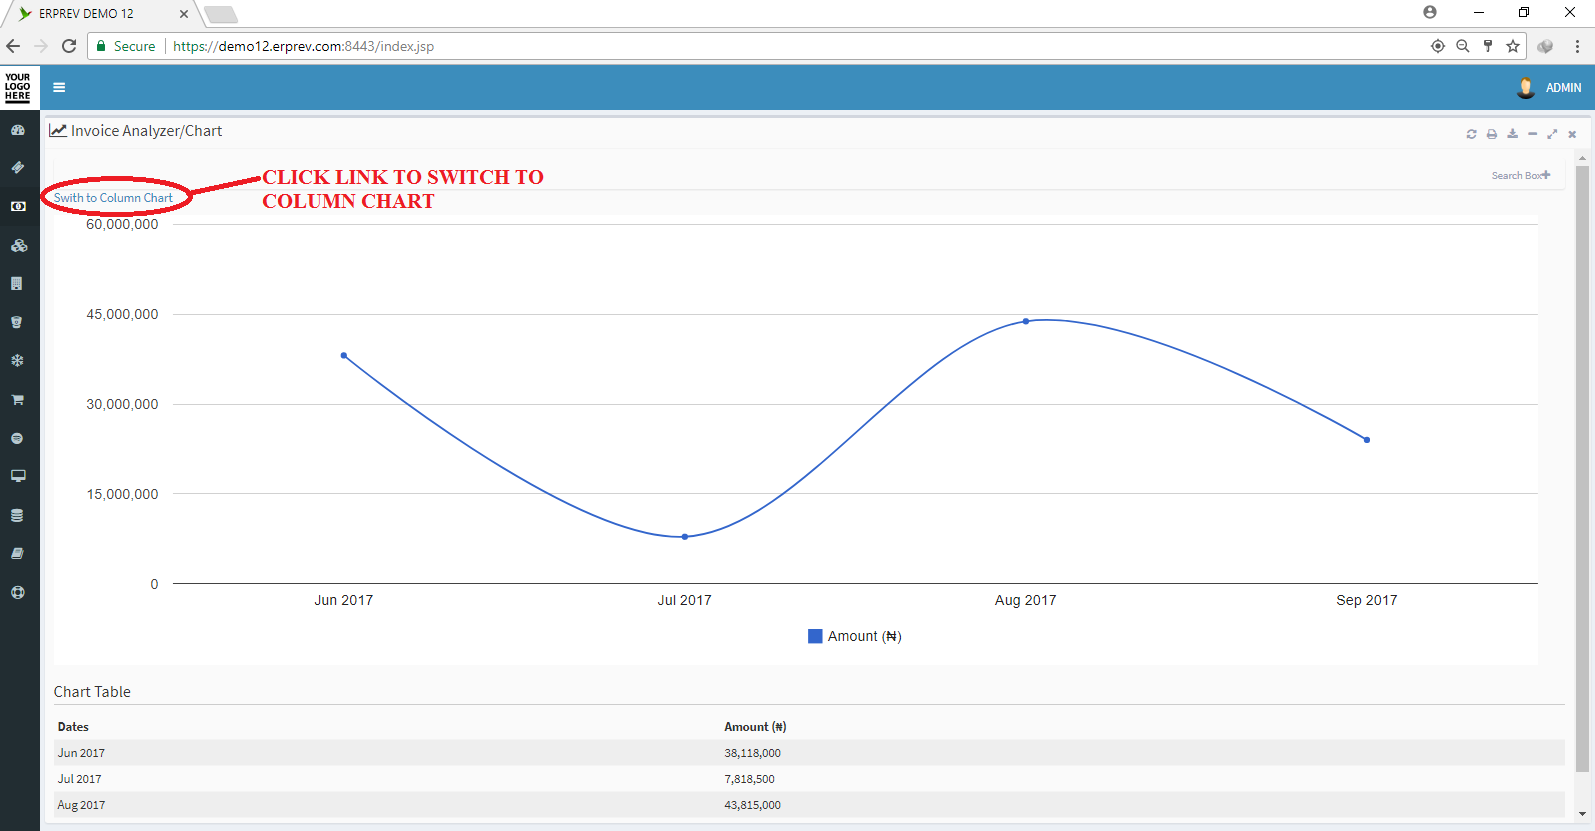
You can switch from Column Chart to Line Chart by CLICKING on the icon indicated in the image below.